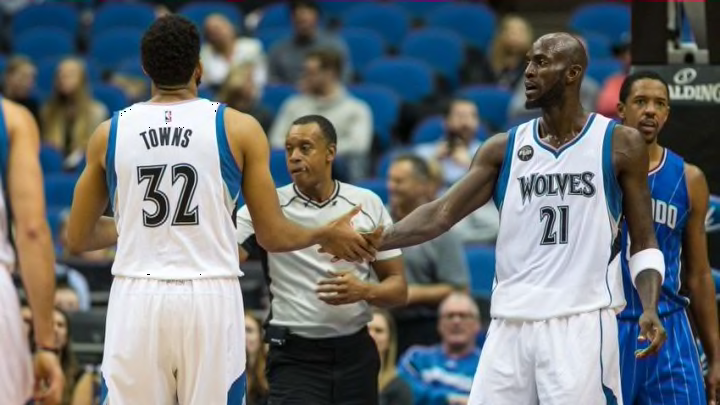
Recently, Timberwolves center Karl-Anthony Towns was featured on the cover of SLAM Magazine, reminiscent of the cover shoot done by all-time great Kevin Garnett, but is that where the similarities end?
Karl-Anthony Towns SLAM magazine cover shoot brought back plenty of memories for lifelong Timberwolves fans. I mean, check it out:
Look familiar, #WolvesNation? pic.twitter.com/NjVAUhl3uV
— Minnesota Timberwolves (@Timberwolves) September 13, 2016
Almost exactly 17 years later, the folks at SLAM Magazine have recreated an iconic magazine in intimidating fashion.
During an interview in this edition of SLAM Magazine, Towns was quoted as saying, “Every time I’m with KG, it feels like, in my opinion, like I’m looking at myself in a mirror.”
That’s quite a statement from the reigning Rookie of the Year. Towns is openly welcoming comparisons to the greatest Timberwolf of all time, not to mention one of the most versatile players the NBA has ever seen.
This begs the question, Is Karl-Anthony Towns really Kevin Garnett’s mirror?
Rk Player Season Age GS MP FG FGA FG% 3P 3PA 3P% eFG% FT FTA FT% ORB DRB TRB AST BLK TOV PF PTS 1 Kevin Garnett 1996-97 20 77 38.9 7.1 14.3 .499 0.1 0.3 .286 .502 2.7 3.5 .754 2.5 5.6 8.0 3.1 2.1 2.3 2.6 17.0 2 Karl-Anthony Towns 2015-16 20 82 32.0 7.6 14.1 .542 0.4 1.1 .341 .555 2.7 3.4 .811 2.8 7.7 10.5 2.0 1.7 2.2 3.0 18.3
Side-by-side are Kevin and Karl’s per-game statistics from their NBA seasons when they were each 20 years old, courtesy of Basketball-Reference.com. (These stats are from Karl’s Rookie of the Year campaign this past year while Kevin’s stats are from 1996-97, KG’s second year in the league.)
After a quick glance, it’s obvious that there is parity in the output of these two players. Between the shots converted, free throws both attempted and converted, offensive rebounds, blocks and points, the mirror comment of Karl’s rings true.
Outside of those numbers, however, is where the comparison begins to drift apart.
The graph below represents the major differences between the two seasons these players had. While Garnett led Towns in minutes played by a margin of 38.9 to 32, Towns proved to be far more effective in fewer minutes.
Karl vs Kevin
Create column charts
On a very basic statistical level Towns’ efficiency is obvious: he attempted 14.1 shots compared to Garnett’s 14.3 while converting on 7.6 of those shots compared to Garnett’s 7.1.
This slight difference places Towns’ field goal percentage nearly five points higher than Garnett’s, at 54.2 compared to 49.9 percent. Two other differences are the defensive rebounding averages and the points per game. Again, the margins aren’t drastic, but they do show a contrast in these two players.
The last three stats on the graph above are what I find most interesting.
Towns’ offensive rating last year was 112 while his Defensive Rating was 106. Garnett, on the other hand, had a much lower Offensive Rating of 107 but had a slightly better Defensive Rating of 105. (Remember, a lower defensive rating is better.) Although Garnett did have a better defensive rating, the differential in Towns offensive to defensive ratings is what sets him apart from Garnett.
Finally is the Player Efficiency Rating, or PER, where the NBA average is 15. In Garnett’s second year, he had a PER of 18.2.
While respectable, Town’s once again beats Garnett with a PER of 22.5 as a sophomore in the NBA. This rating placed Towns 13th in the league in PER — above Kyle Lowry, Damian Lillard and LaMarcus Aldridge, while Garnett did not finish in the top-20 in 1996-97.
In conclusion, Towns’ comment does hold some weight, but the statistics show that Towns is ahead of Garnett at this point in his career.
Next: Las Vegas' Win Total Over/Under For The Timberwolves
Of course, if this turns into a trend and continues into the future, Timberwolves fans are going to be extremely blessed to have Towns on their side — and that’s an understatement.
